




Carrier Contract Optimization for High-Volume Shippers

Take command of transportation spend with AI-powered contract analysis. FreightOptics compares parcel, LTL, and FTL rates, surcharges, and terms against your shipping profile so your team enters carrier decisions with better information and can target average savings of 18-25%.

Transportation spend on equal volume falling 22 percent over a year against the do-nothing baseline

Trusted by leaders across industries

Why Carrier Contracts Are Costing You More Than You Think

High-volume shippers face financial risk from complex, volatile carrier contracts, leaving them at a negotiating disadvantage without a data-driven strategy.

A carrier rate agreement showing the contracted base rate unchanged while the fuel surcharge table, accessorial schedule, minimum charge and service class rules have all been revised
Included

Market Volatility Erodes Your Budget

Carrier pricing changes can make an existing agreement more expensive than expected and create gaps between forecast and actual transportation spend.

Included

Masked Complexity Hides Savings

Minimum charges, accessorials, discount tiers, classifications, and service rules can change true cost-to-serve even when the base rate looks competitive.

Included

Limited Resources Prevent Proactive Analysis

Daily operating demands can leave teams without time to model rate scenarios or compare agreement terms with shipment data.

A Complete Carrier Contract Optimization Solution

Rate report reviewed against contract terms on schedule

Multi-Modal Market Rate Analysis

Compare parcel, LTL, and FTL agreement terms with the market-rate data available in FreightOptics, then measure the differences against your shipment profile.

Surcharge and accessorial rates as a percentage of spend

Comprehensive Surcharge & Rules Analysis

Model accessorials, minimums, GRIs, and other contract terms against historical shipments to see which provisions change total spend.

Managed service delivered by a FreightOptics specialist

Decision-Ready Contract Analysis

FreightOptics turns rate, surcharge, and market comparisons into clear priorities your team can use in carrier discussions.

Use Contract Data to Protect Transportation Margin

Spend before and after contract optimization for parcel, LTL and FTL, reduced 21, 19 and 24 percent

Protect Margins With an 18-25% Average Reduction in Spend

FreightOptics compares rate structures and surcharge rules with shipment data to identify the contract terms contributing most to spend. Across those terms, clients average an 18-25% reduction.

Spend before and after contract optimization for parcel, LTL and FTL, reduced 21, 19 and 24 percent

Protect Margins With an 18-25% Average Reduction in Spend

FreightOptics compares rate structures and surcharge rules with shipment data to identify the contract terms contributing most to spend. Across those terms, clients average an 18-25% reduction.

Monthly transportation spend forecast tracking actual billed spend across a year

Build More Predictable Transportation Budgets

Model the cost impact of contract terms across modes, forecast transportation expenses with greater accuracy, and reduce surprise charges.

Contract performance: 21 percent spend reduction, 95.4 percent forecast accuracy, 12 terms out of policy, 6 carriers under contract

Clarify Terms and Carrier Accountability

Use contract intelligence to evaluate service levels, liability, and fees, then define clearer priorities for carrier discussions and ongoing performance review.

Monthly transportation spend forecast tracking actual billed spend across a year

Build More Predictable Transportation Budgets

Model the cost impact of contract terms across modes, forecast transportation expenses with greater accuracy, and reduce surprise charges.

Contract performance summary: 21 percent spend reduction, 95.4 percent forecast accuracy, 12 terms out of policy, 6 carriers under contract

Clarify Terms and Carrier Accountability

Use contract intelligence to evaluate service levels, liability, and fees, then define clearer priorities for carrier discussions and ongoing performance review.

How We Model Your True Carrier Costs in a Volatile Market

We analyze shipping data against contract terms to calculate true cost-to-serve and show which rates, surcharges, and service rules give you the upper hand in carrier negotiations.

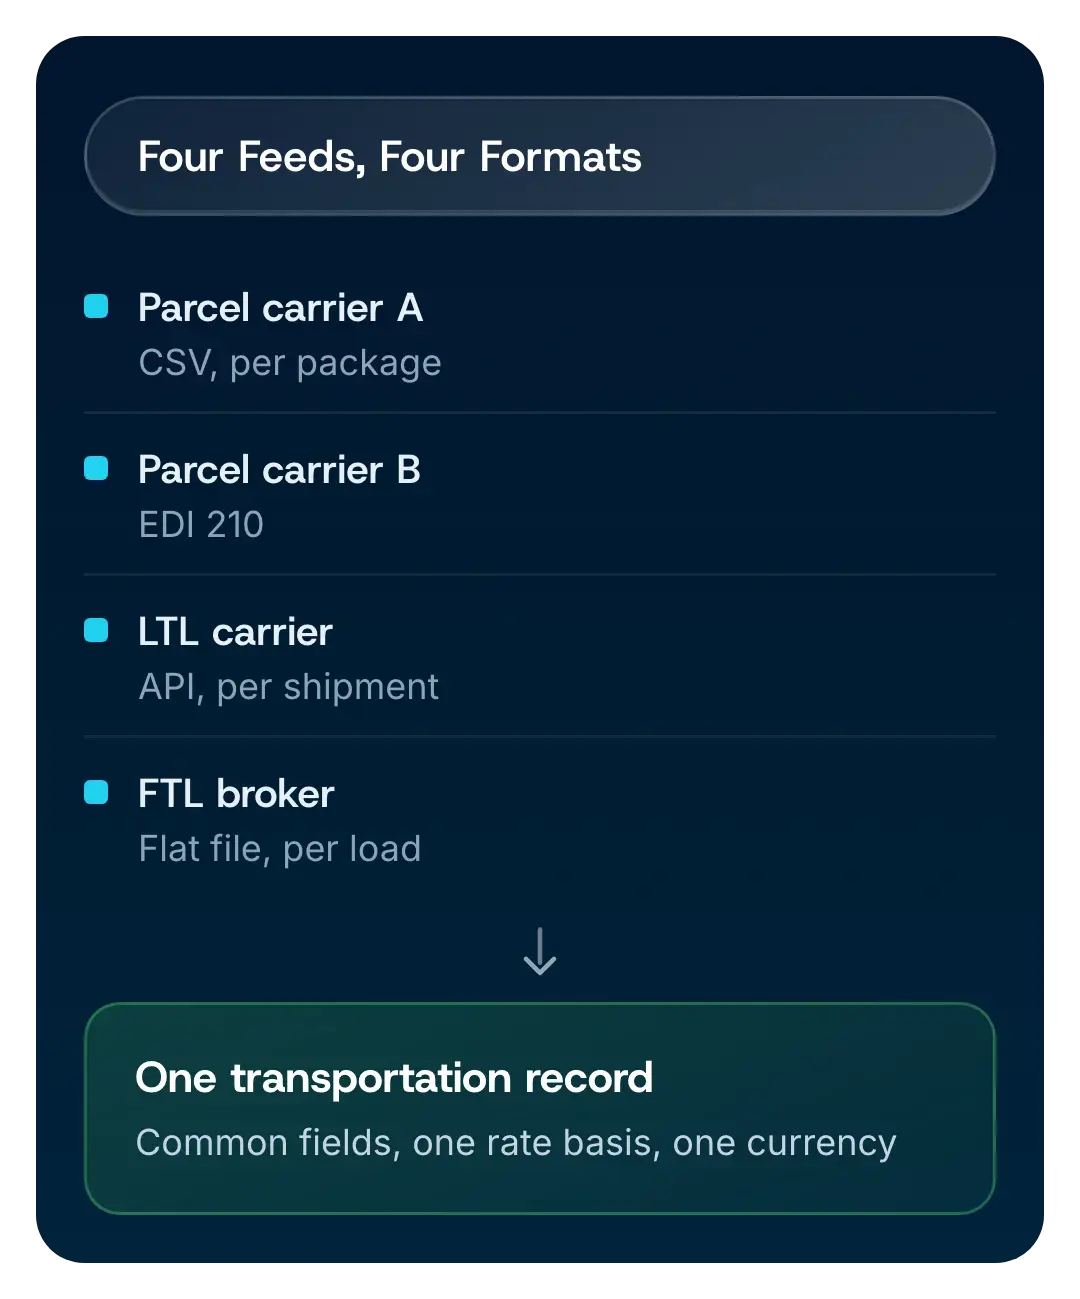
Unifying Your Multi-Carrier Shipping Data

The platform aggregates and normalizes shipment data from connected parcel and freight carriers, creating one view of lanes, services, charges, and spend.

Four carrier feeds in four different formats normalized into one transportation record

Surcharge, Accessorial & Rule Exposure Analysis

Analyze GRIs, fuel, and accessorial charges by carrier to see how variable costs affect the budget beyond base rates.

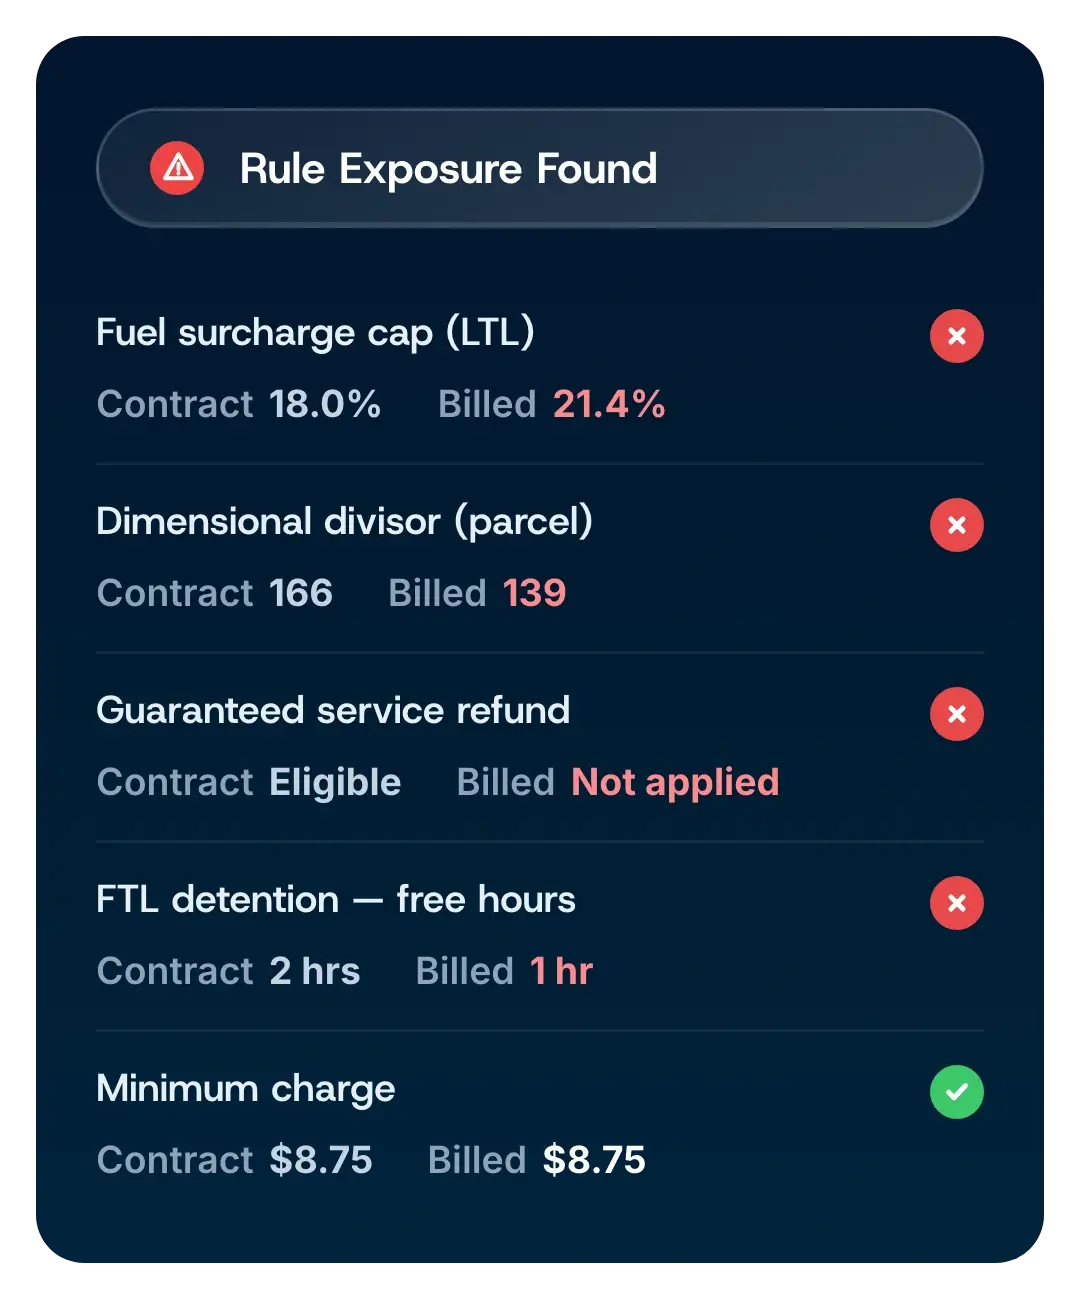
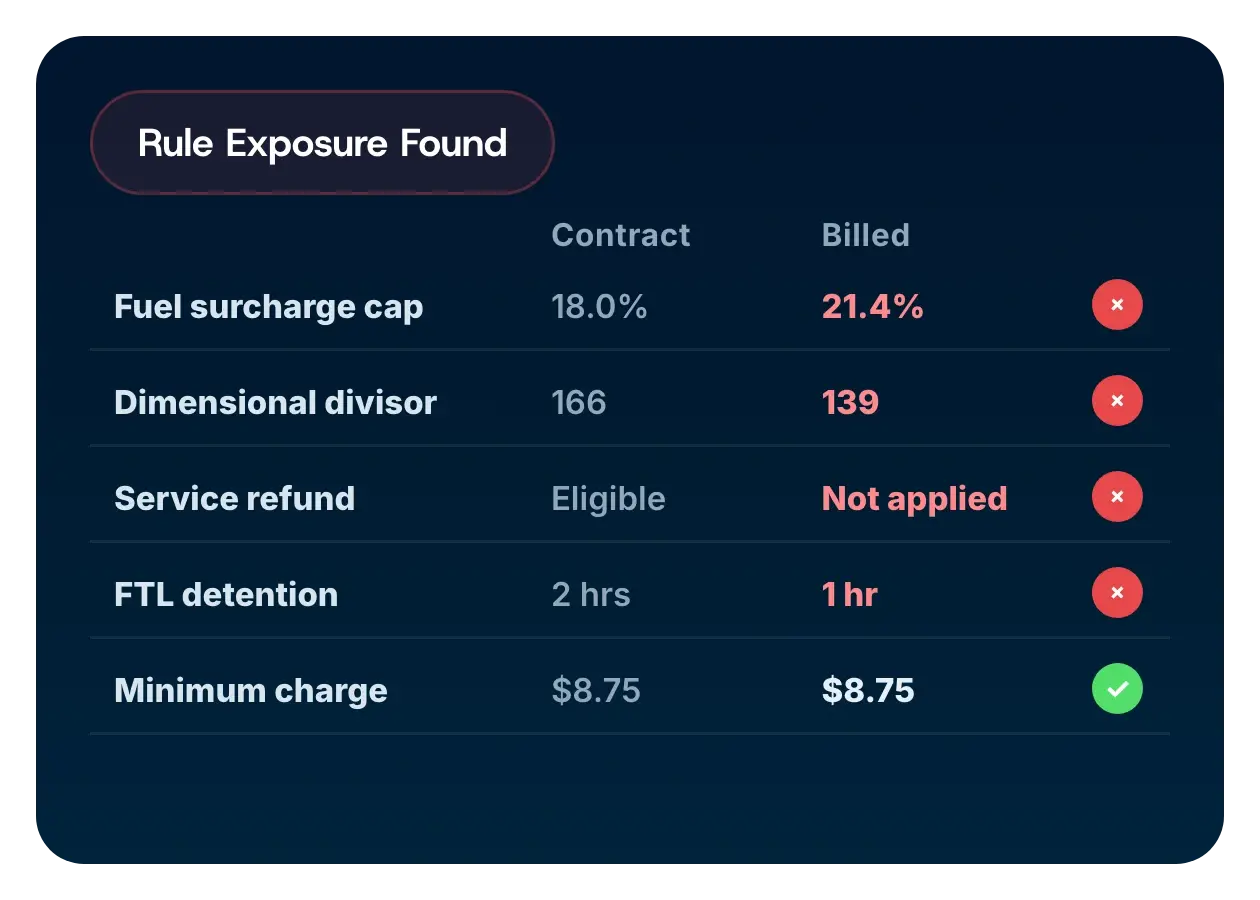
Five carrier-contract rules with the contracted term beside what was actually billed, including fuel surcharge, dimensional divisor, guaranteed-service refund, detention, and minimum charge
Five carrier contract rules with the contracted term beside what was actually billed: fuel surcharge cap, dimensional divisor, guaranteed service refund and FTL detention hours all billed outside the contract, minimum charge billed correctly

Contract Performance & Budget Forecasting

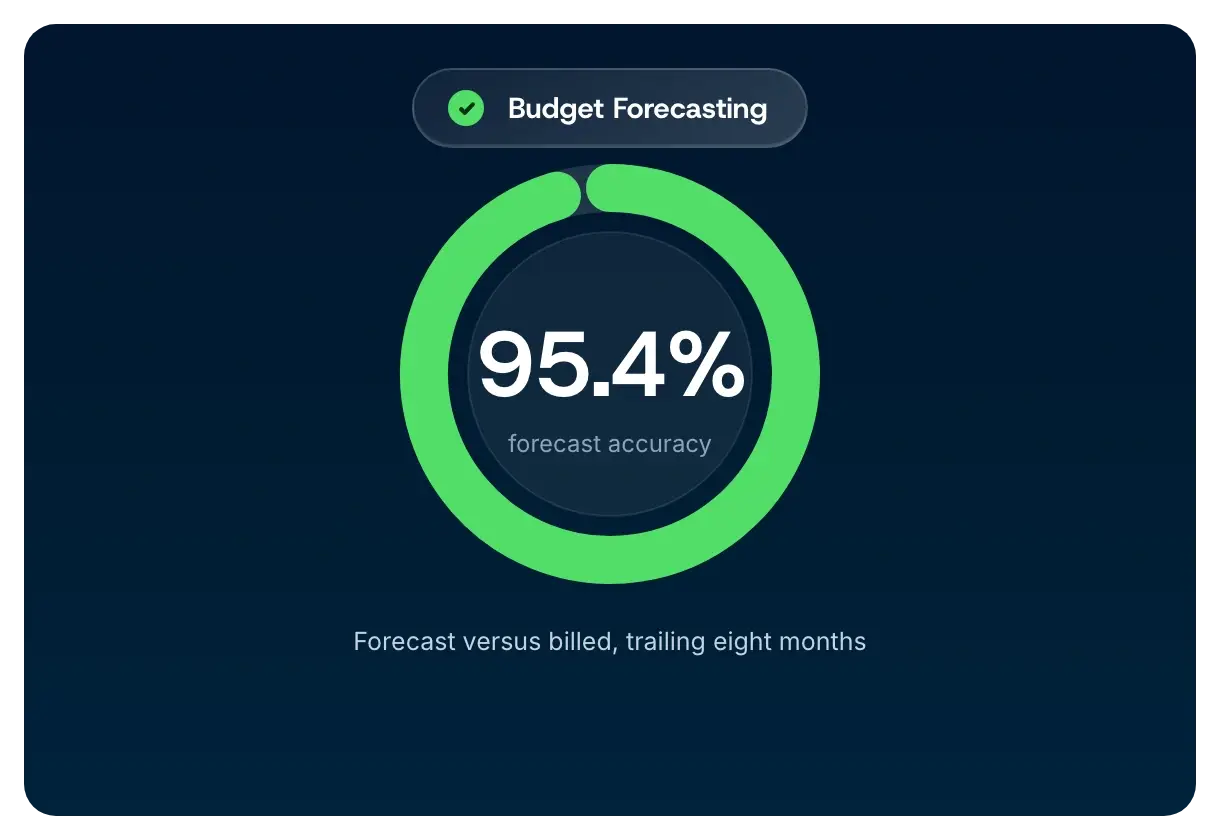
Reports compare current contract terms with billed shipment activity, helping finance teams forecast spend and explain changes by rate, surcharge, lane, and service.

Budget forecast accuracy of 95.4 percent, forecast versus billed over the trailing eight months

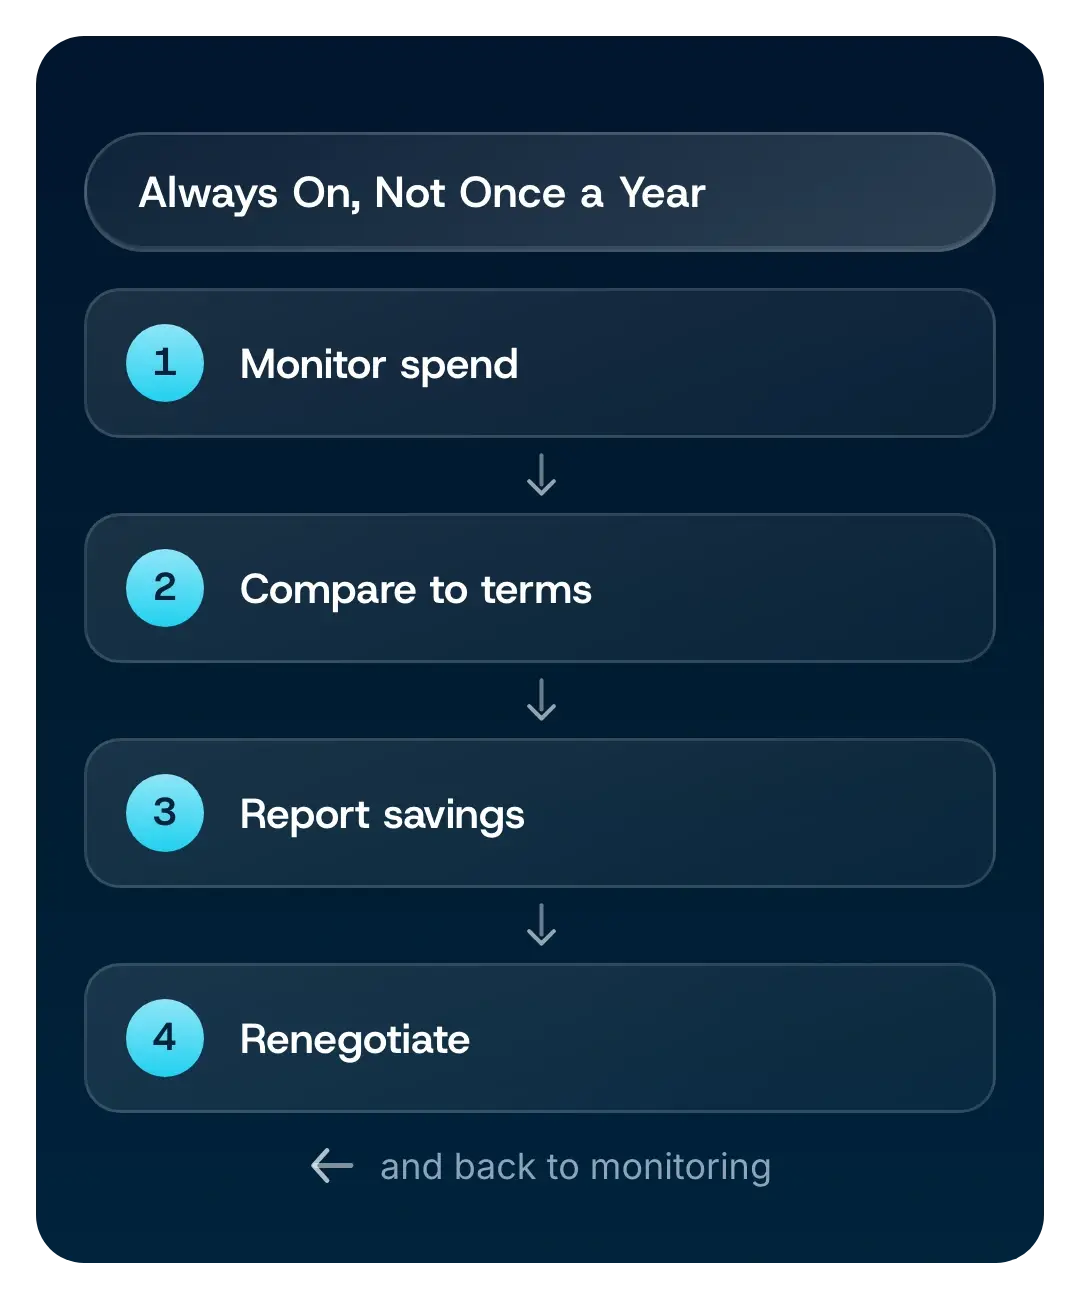
Continuous Optimization & Savings Monitoring

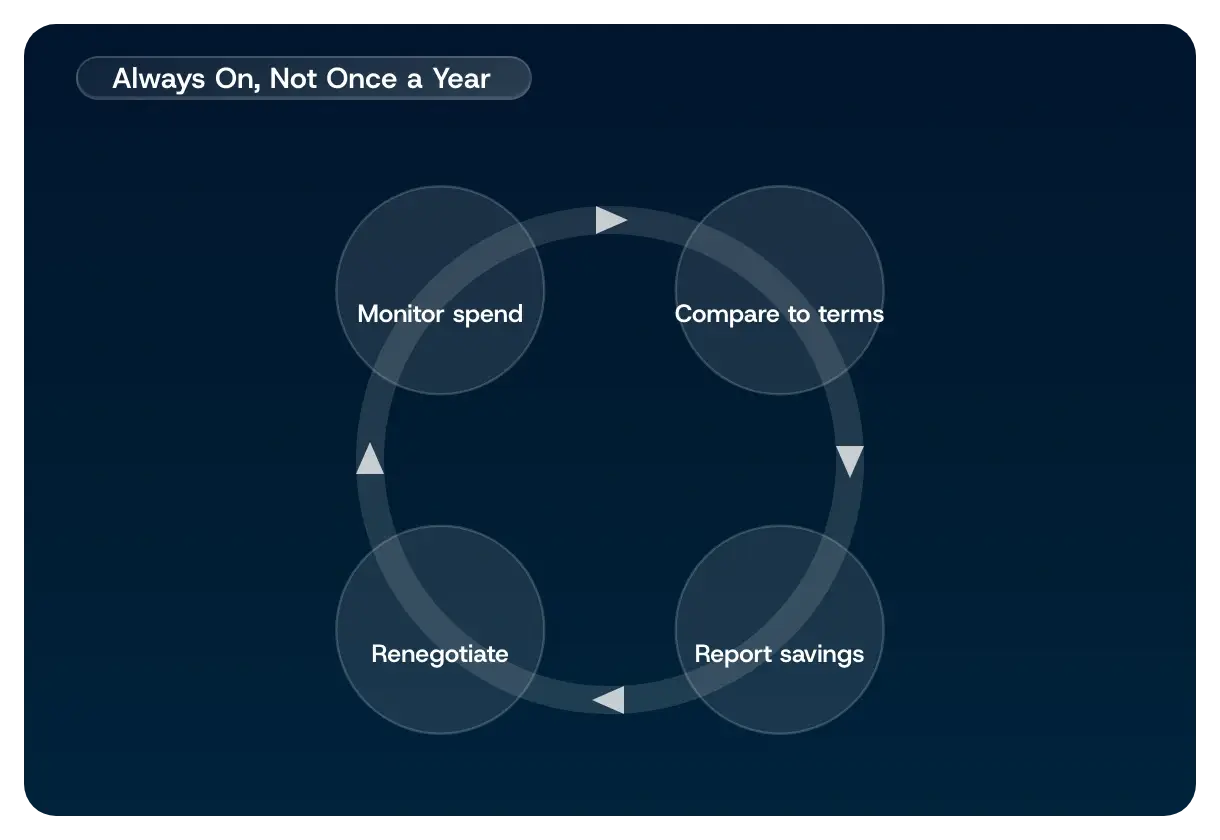
The platform monitors spend and performance over time, comparing billed costs with the established baseline and flagging rate, surcharge, or service changes as your shipping profile and costs evolve.

A continuous loop: monitor spend, compare to terms, report savings, renegotiate

Integration and Enterprise-Grade Security

The SOC 2 Type II certified platform supports secure handling of shipping and financial data, with the data integrity enterprise IT and finance teams expect.

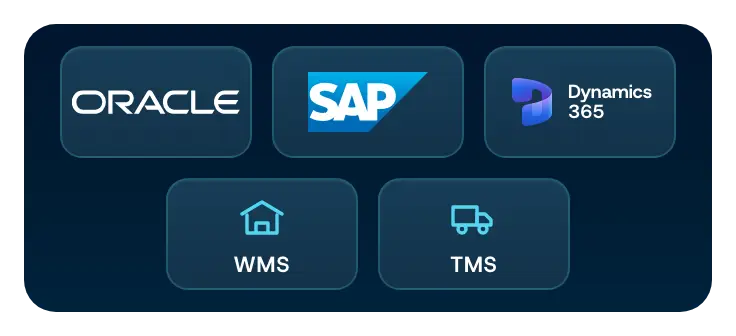
Oracle, SAP, Microsoft Dynamics, WMS and TMS integration logos

Core System Integrations

Connect directly with your existing ERP, WMS, and order management systems.

API and EDI data exchange methods supported by FreightOptics

Flexible Data Exchange

Ingest contract and shipment data through API, EDI, or secure file transfer.

SOC 2 Type II and GDPR compliance badges attested through Thoropass

Certified Enterprise-Grade Security

FreightOptics is SOC 2 Type II certified and GDPR compliant.

Our Carrier Contract Optimization Process

A Six-Step Contract Optimization Process

1
Assessment of current transportation spend

Assessment

Review current contracts and shipment data to establish a cost baseline and identify the rate, surcharge, and service terms that need attention.

2
Program aligned to the shipper's targets

Alignment

Define the business priorities, decision owners, carrier participants, and target terms that will guide the review.

3
Advisement on recoverable spend and next steps

Advisement

Review proposals against rate and contract analysis, then refine the priorities your team will bring to carrier discussions.

4
Signed agreement to begin the program

Agreement

Compare carrier options and document the terms your team selects, creating a clear handoff for implementation and monitoring.

5
Implementation of the audit program

Implementation

Apply selected contract terms to routing, audit, and reporting workflows so teams can monitor invoice accuracy and carrier performance.

6
Ongoing maintenance of the running program

Maintenance

Track contract performance and cost changes, then flag spend or carrier shifts that call negotiated terms into question.

The FreightOptics Advantage in Carrier Contract Optimization

Carrier contract tools and services differ in market context, analysis depth, and who owns each decision. FreightOptics centralizes rate, surcharge, and contract analysis so your team can compare operating models clearly.

Capability

FreightOptics

Traditional Service Providers

Self-Service Platforms

Strategy & Analysis

Continuous optimization powered by tech and experts.

Project-based analysis and reporting.

Analytics platform requires your team’s expertise.

Market Intelligence

Rate and term analysis based on your shipment profile, current agreements, and documented rate comparisons.

Analysis derived from past consulting engagements.

Internal analysis only, with no market context.

Post-Negotiation Value

Ongoing savings validation & contract management.

Final report delivered at end of engagement.

Your team must manually monitor for compliance.

The Human Element

Ongoing strategic partnership with industry veterans.

Project-scoped senior consultant engagement.

Standard technical support for the platform.

Capability

FreightOptics

Traditional Service Providers

Self-Service Platforms

Audit & Recovery

Fully Managed Recovery

Our experts actively recover all identified savings for you.

Standardized Rules

May miss shipper-specific nuances in contracts.

Requires Manual Config

Needs user setup for complex, contract-specific issues.

Contract Negotiation

Expert-Led Negotiation

Go into carrier discussions with stronger positions on rates and terms. FreightOptics specialists prepare them using your shipment and contract data.

Client-Led Process

Provides market data, but the negotiation remains with your team.

Data Only

Leaves the entire complex negotiation process to your team.

Claims Management

End-to-End Management

We manage the entire claims process from filing to resolution.

Limited Involvement

Follow-up and management often remain with the client’s team.

Full Burden on Client

Your internal team must handle the entire tedious process.

Transportation Spend Intelligence

Actionable, Strategic Insights

We deliver C-suite level recommendations to optimize your network.

Standard Reporting

Strategic analysis is often a separate consulting engagement.

Raw Data Dashboards

Requires your team to perform all analysis and interpretation.

Capability: Packaging Optimization

Proactive Analysis

Identify DIM weight and surcharge drivers to lower costs and improve sustainability.

Overlooked

Packaging inefficiencies and dimensional charges are often ignored.

Not Included

Your team must manage packaging analysis separately.

Trusted by High-Volume Shippers

VP, Supply Chain / Manufacturing / Supply Chain

$500M to $1B

Intuitive Dashboard And Effective Data Analysis To Support Business Needs

“Exceptional customer support throughout the implementation. Was up and running quickly once we initiated the agreement between our companies. The data analysis is very powerful and will enable us to make better business decisions going forward. Was able to set up weekly reports for our teams to take action, making us more efficient and saving us money.”

VP, Operations / Consumer Goods / Operations

$500M to $1B

Better With Them Than Without

“FreightOptics is very transparent in their approach. FreightOptics is also collaborative with us on our requests to educate how the program works. They also provided some financial guidance on the terms of agreements even though we were the decision makers. We enjoy working with the FreightOptics team.”

Director of Supply Chain Management

$3B to $10B

FreightOptics' Solution Has Improved Visibility And Resulting In Net Savings

“FreightOptics has provided a seamless customer experience from discovery through implementation and has delivered on their promise to us. The value FreightOptics brings my customer results in net savings and has greatly improved visibility. My expectations have been exceeded.”

CFO / Manufacturing / Finance

<50M USD

Fantastic Service, Great Company To Work With

“FreightOptics has provided a valuable resource for us. From contract negotiations to operational support – they take the worry off of us with a significant cost factor in our overall operations.”

Chief Financial Officer / Manufacturing / Finance

<50M USD

FreightOptics Revolutionizes Transport Management With Cost-Effective Pricing And Support

“FreightOptics has genuinely revolutionized our transportation management providing first class service, support and more cost effective pricing.”

Frequently Asked Questions

Carrier contract optimization reviews parcel, LTL, and FTL rates, surcharges, minimums, and service terms against how a company ships. It matters because a base-rate discount can hide accessorial costs, pricing tiers, and other terms that change actual transportation spend and make budgets harder to forecast in each billing cycle.

Each mode has unique cost structures:

  • Parcel contracts include dimensional weight rules, minimum charges, and tiered discounts.
  • LTL contracts use class-based pricing, base rate tariffs, and negotiated discounts.
  • FTL contracts are typically lane-based with fuel surcharges and accessorials.

Optimization must be tailored to each mode to capture all potential savings.

Common hidden costs include:

  • Accessorial fees (liftgate, residential delivery, limited access)
  • Fuel surcharges
  • Minimum shipment charges
  • Annual general rate increases (GRIs). These charges can materially increase total transportation spend when they are not modeled and reviewed together.

Savings vary by shipment profile and contract position. FreightOptics clients average 18-25% in savings across parcel, LTL, and FTL modes.

These variable charges often make up a significant portion of overall spend. For example, fuel surcharges can fluctuate weekly, GRIs increase base rates annually, and accessorials can be applied inconsistently. Without oversight, they create budget uncertainty and reduce profitability.

See which proposed terms warrant attention before carrier discussions. FreightOptics compares them with your shipment data using contract analysis, rate comparison, and scenario modeling.

  • Data integration and analysis. Import and analyze shipment data across modes.
  • Strategy and modeling. Identify savings opportunities through contract modeling.
  • Negotiation support. Equip your team with rate, surcharge, and term comparisons for carrier discussions.
  • Performance tracking. Compare billed costs with the established contract baseline.

Data modeling allows shippers to simulate the financial impact of different contract terms. For example, you can test how changes to minimum charges or discount tiers affect total spend. This insight helps negotiators focus on the areas that will drive the greatest savings.

Yes. FreightOptics checks shipment data against contracted rates and fees. Reports measure realized savings, flag discrepancies, and show the rate or surcharge changes affecting transportation spend and your contract performance over time.

See true cost-to-serve across rates, surcharges, lanes, and services in one record. Bring that evidence into carrier negotiations, then track whether new terms perform against your actual shipment mix once they take effect across your network.

Yes. FreightOptics supports integrations with leading ERP, WMS, and TMS systems. Data can flow through APIs, EDI, or secure file transfer. The FreightOptics team works alongside your IT team to plan the connection.

Review Your Carrier Agreements

Tell us which carriers you use, where you ship, and what you want to change in your next negotiation. We’ll talk through the rates, surcharges, and contract terms that matter most.

More than $1.7 billion in verified savings over 23 years.

Prefer to start with a conversation? info@freightoptics.com  ·  +1 800-578-4939

Request Your Analysis

Name(Required)

Your information is confidential.