Command Your Transportation Data

Ask IRIS about connected transportation data. See the answer as a chart or table, investigate what changed, or open the supporting invoice or FreightOptics screen.

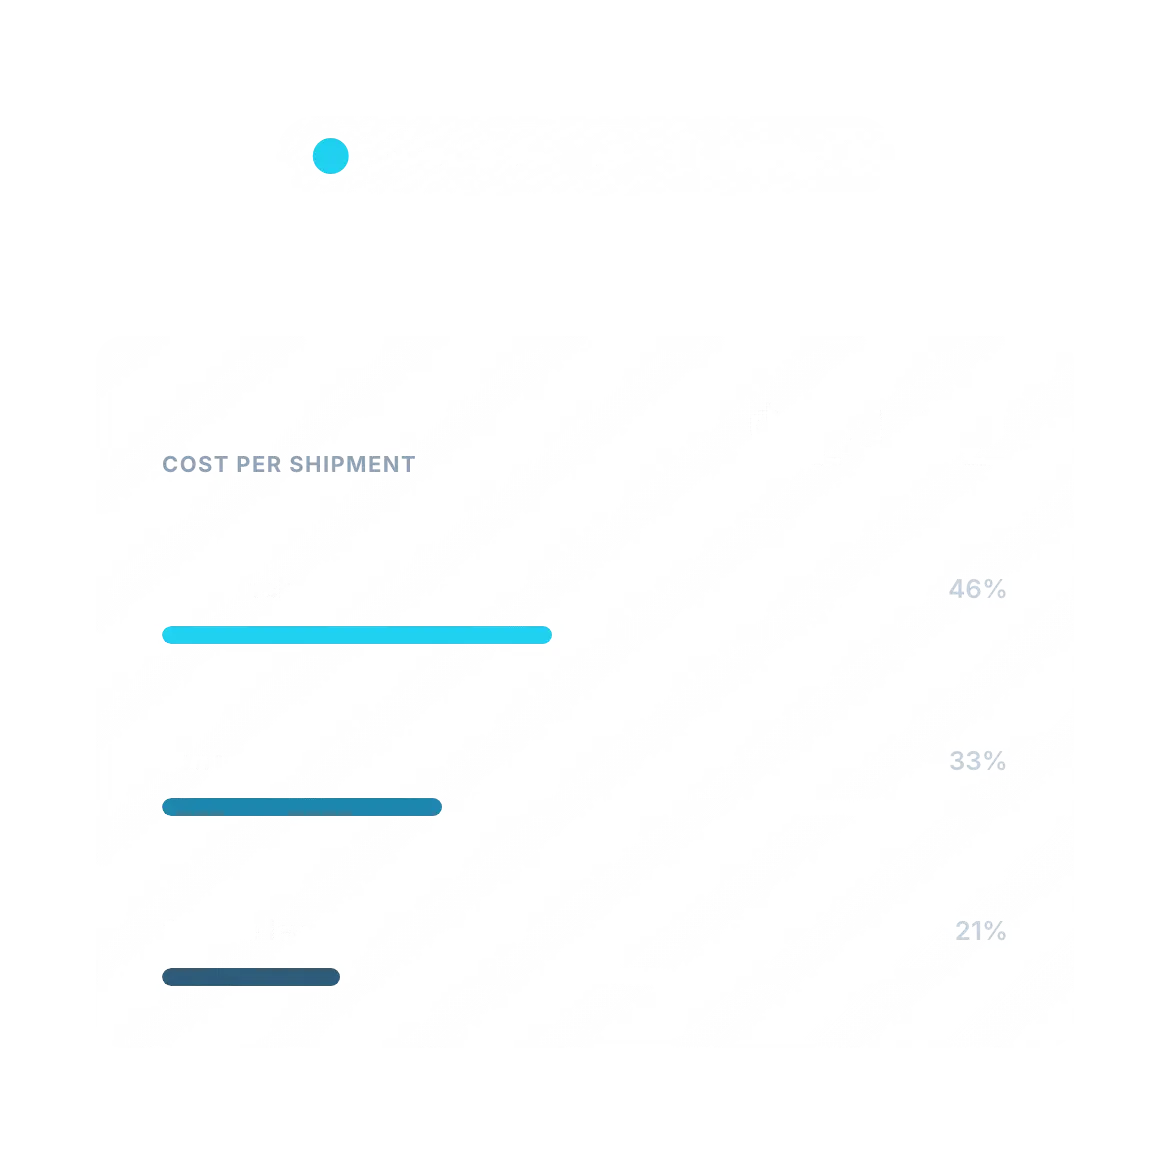
Panel showing cost per shipment broken into its drivers, fuel surcharge, zone mix and service level, each with its share of the total.

Connect the Carrier and Transportation Data Your Team Uses

Visualize and Understand Transportation Data

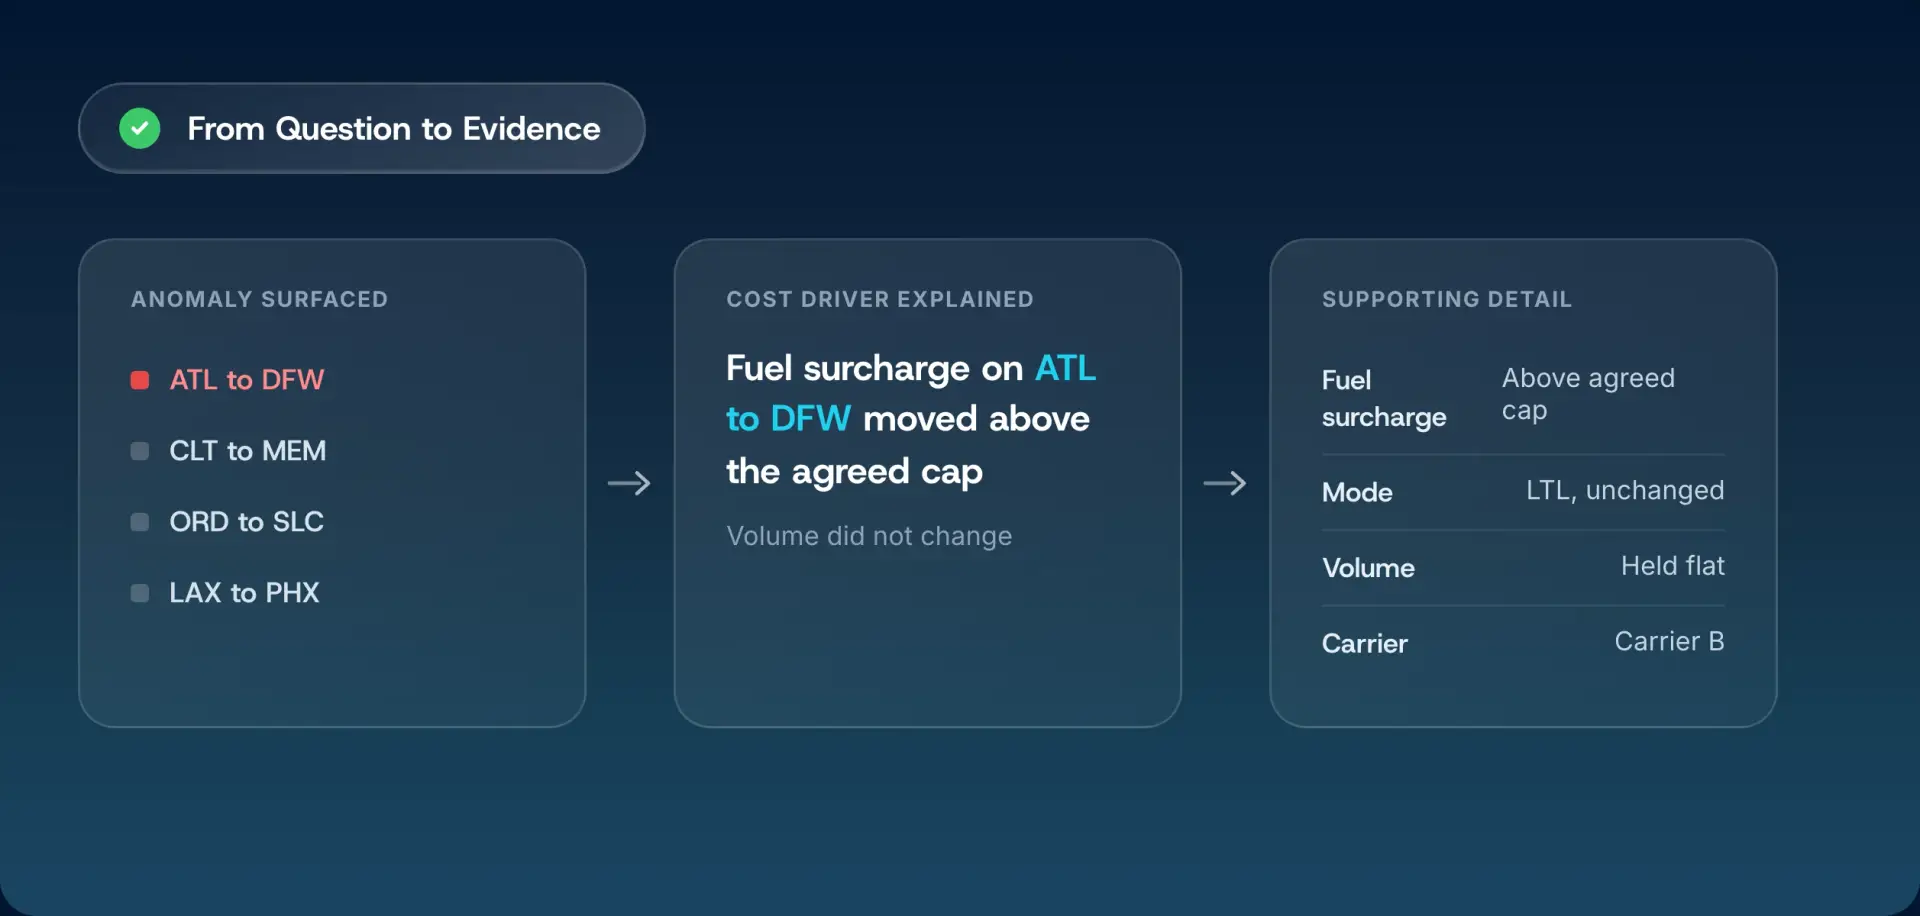
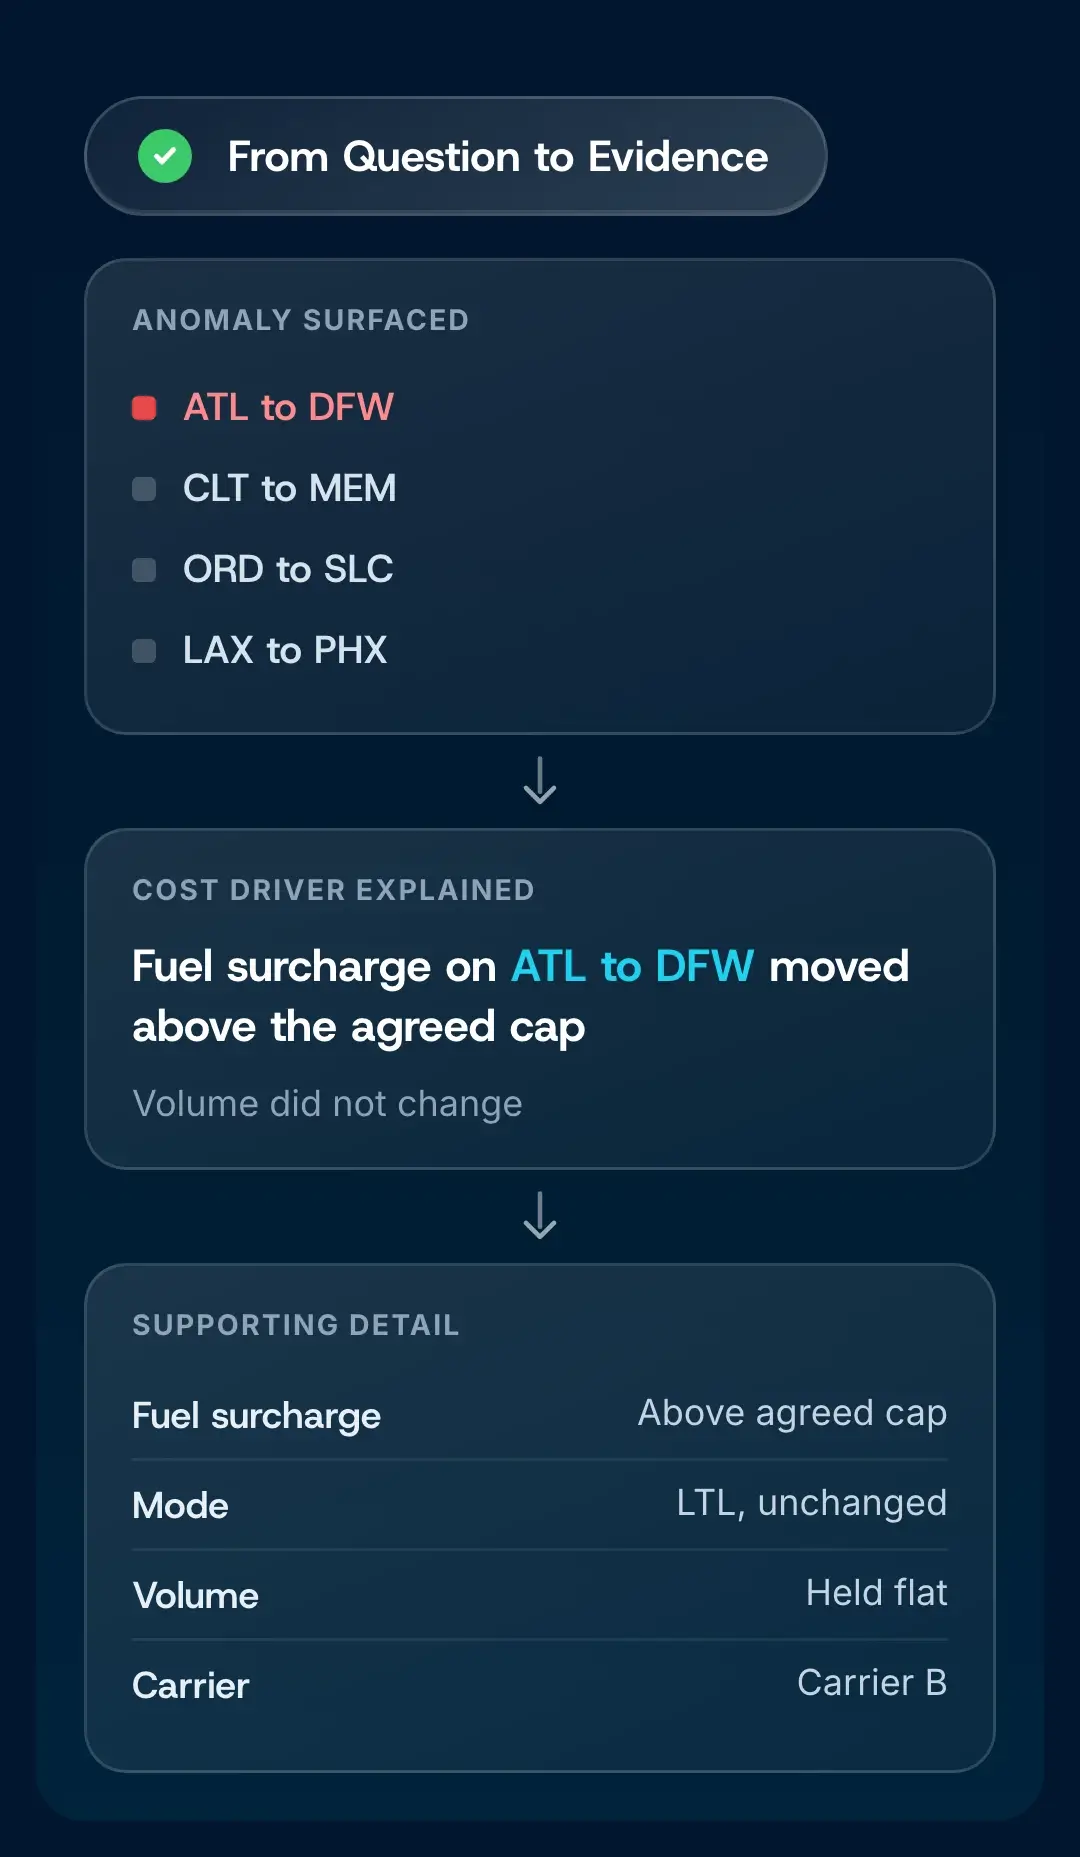
FreightOptics turns connected transportation data into decision-ready views. IRIS can surface anomalies, explain likely cost drivers, and show where carrier or mode performance changed. Your team can investigate the supporting lane or invoice data behind the change.

An anomaly surfaced on one lane, the cost driver explained as a fuel surcharge above the agreed cap, and the supporting transportation detail behind it
An anomaly surfaced on the ATL to DFW lane, the cost driver explained as a fuel surcharge above the agreed cap, and the supporting transportation detail behind it
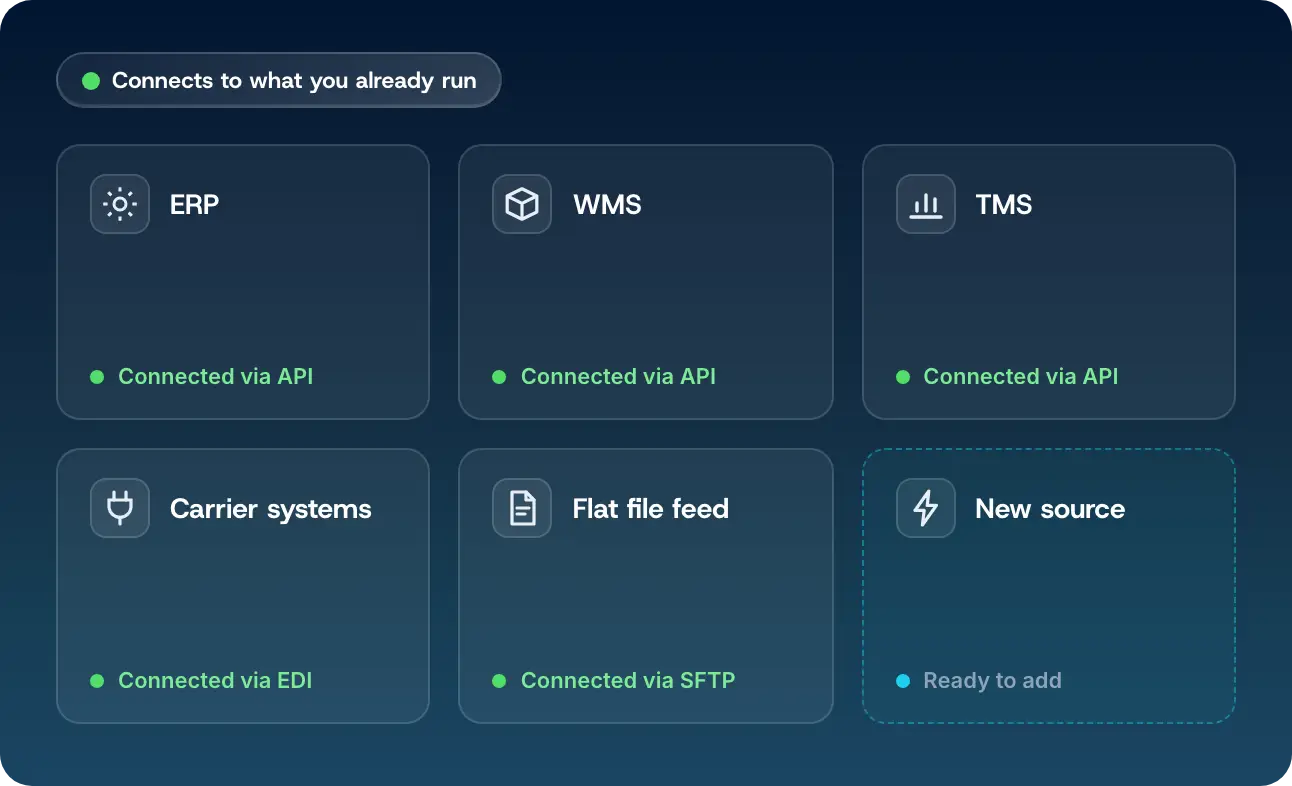
Six connection tiles covering ERP, WMS, TMS, carrier systems and flat file feeds, five connected and one open for a new source.

Integrate Your Existing Systems

Bring supported ERP, WMS, and transportation data into one FreightOptics view through the connection method agreed with your team during onboarding.

Ask IRIS About Your Transportation Data

Ask IRIS about connected transportation data. It can return a chart or table, investigate an anomaly, find an invoice, run a report, open a FreightOptics screen, or answer from help content and the glossary.

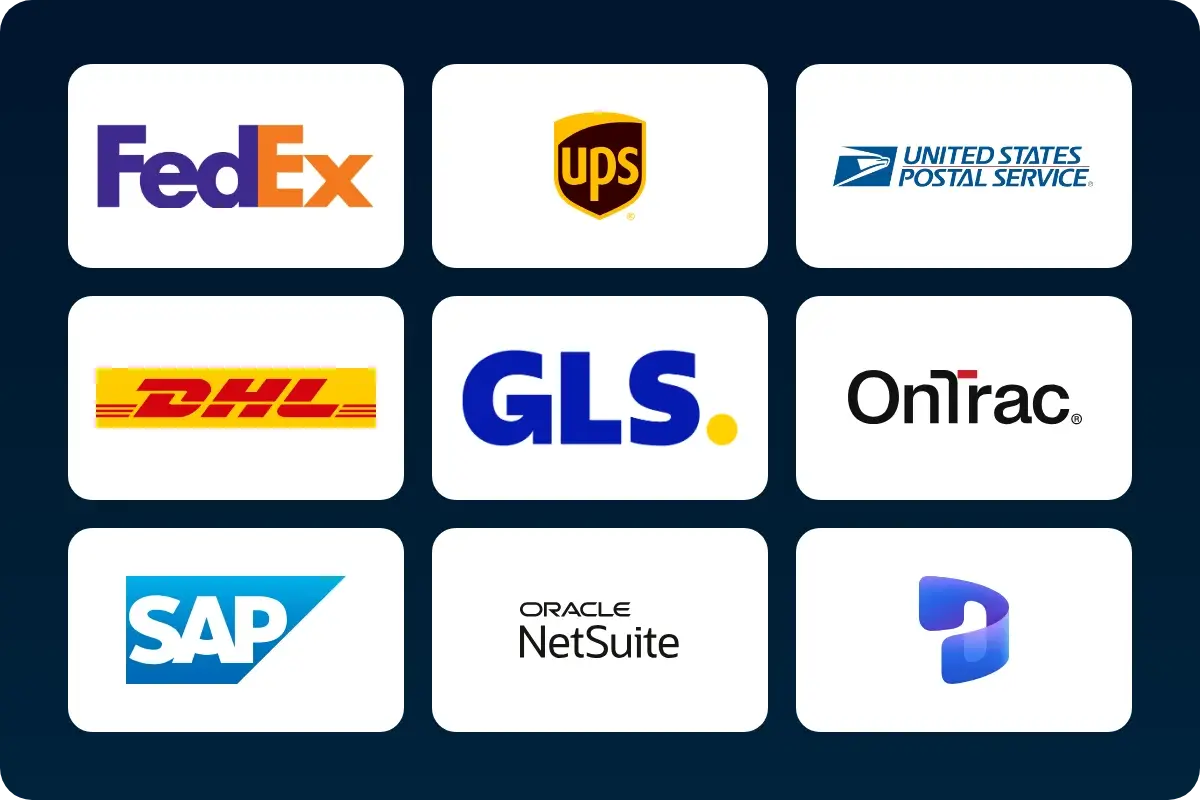
Carriers and systems FreightOptics connects to: FedEx, UPS, USPS, DHL, GLS, OnTrac, SAP, Oracle NetSuite and Microsoft Dynamics 365

Use Transportation Data to Control Spend

Use IRIS to move from a question to the supporting transportation data. Your team reviews the result and decides what should happen next.

Carrier payment

Ask a Spend Question

FreightOptics organizes carrier files and billing codes into a consistent transportation record across parcel, LTL, truckload, ocean, and air.
Rate agreement with an agreed price

Investigate an Anomaly

Ask Iris where spend is climbing, which carrier changed, or what is driving an exception. Iris answers from the transportation data in FreightOptics and recommends where to look next.
Shipping rate calculated

Find an Invoice

Trace a flagged charge to the carrier, service, shipment, invoice, and contract term behind it.
Charge document allocated across general ledger codes

Run a Report

Review cost, service, and exception patterns across carriers and modes without rebuilding the report.
Charges verified against the contract

Open the Right Screen

See which rates, surcharges, and service rules are changing transportation spend before the next carrier discussion.
Transportation spend intelligence dashboard

Get a Sourced Answer

When you need managed execution beyond the platform, explore Freight Audit and Payment, Carrier Contract Optimization, Freight Claim Management, Transportation Management System, and Duty Drawback.
Transportation spend

Carrier Contract Optimization

Carrier network connected to one system

Freight Claim Management

Transportation spend

TMS and Duty Drawback

See Your Transportation Data Together

See carrier, mode, and invoice data in one view. We will walk through the platform and discuss your reporting needs.

More than $1.7 billion in verified savings over 23 years.

Prefer to start with a conversation? info@freightoptics.com  ·  +1 800-578-4939

Request a Demo

Name(Required)

Your information is confidential.