Ask IRIS about connected transportation data. See the answer as a chart or table, investigate what changed, or open the supporting invoice or FreightOptics screen.
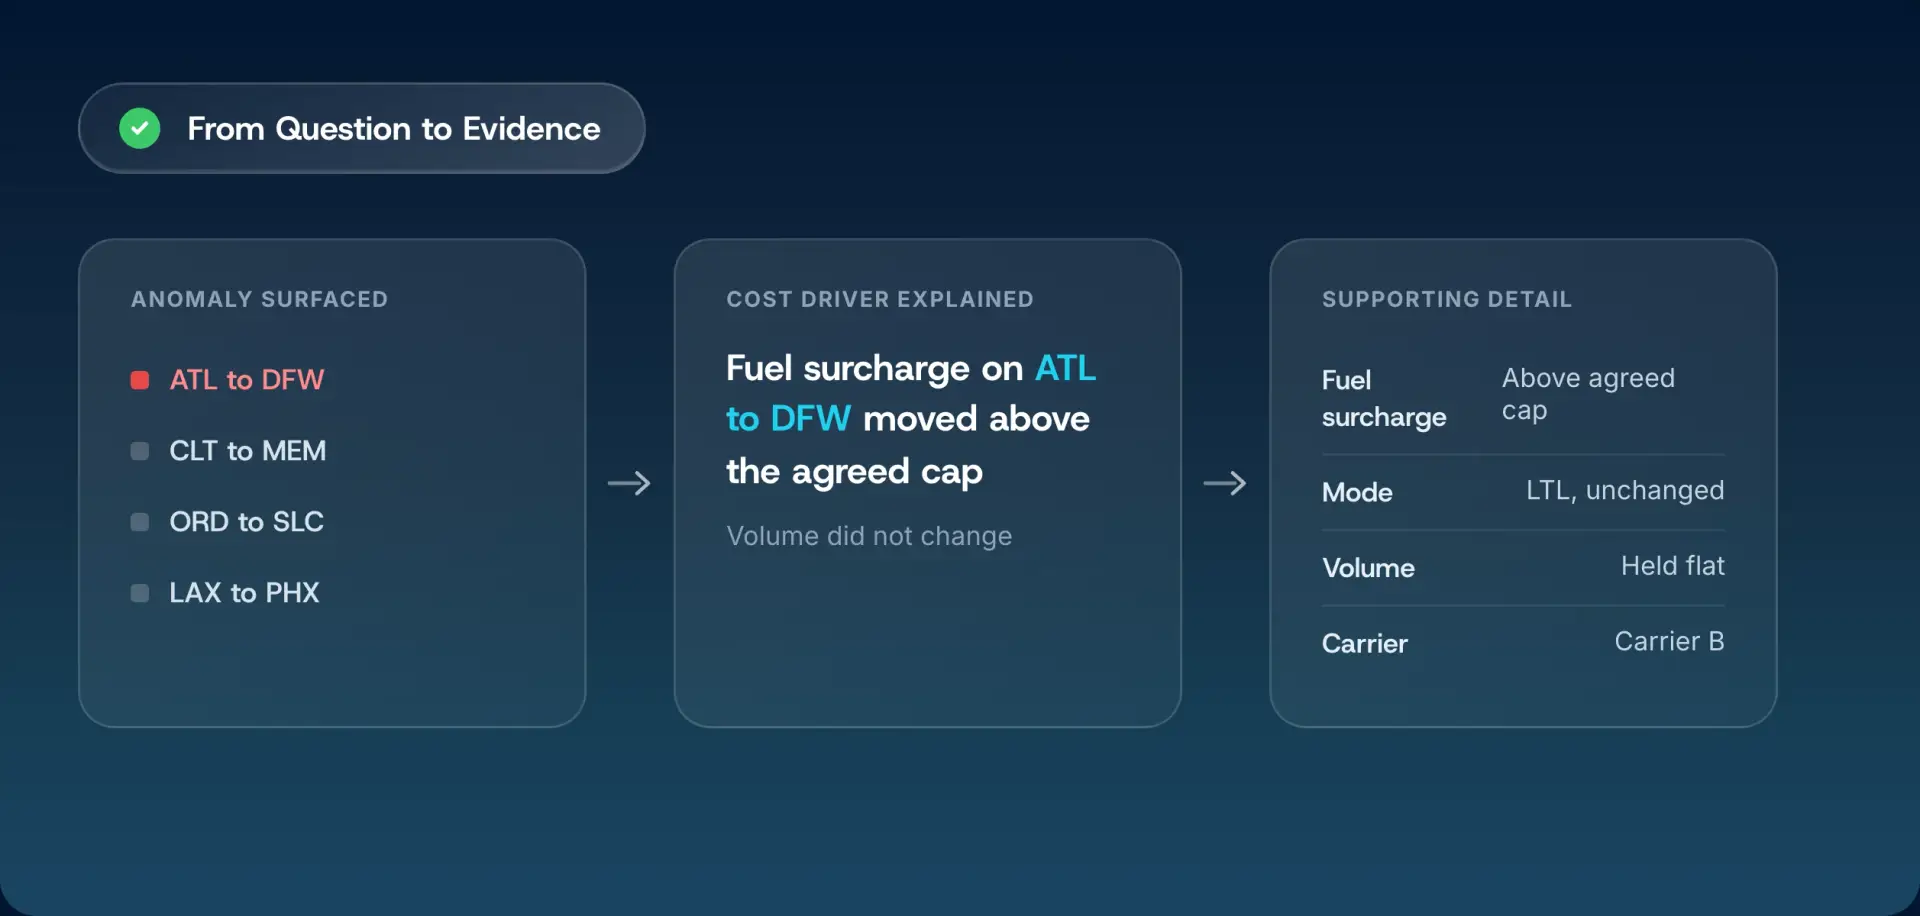
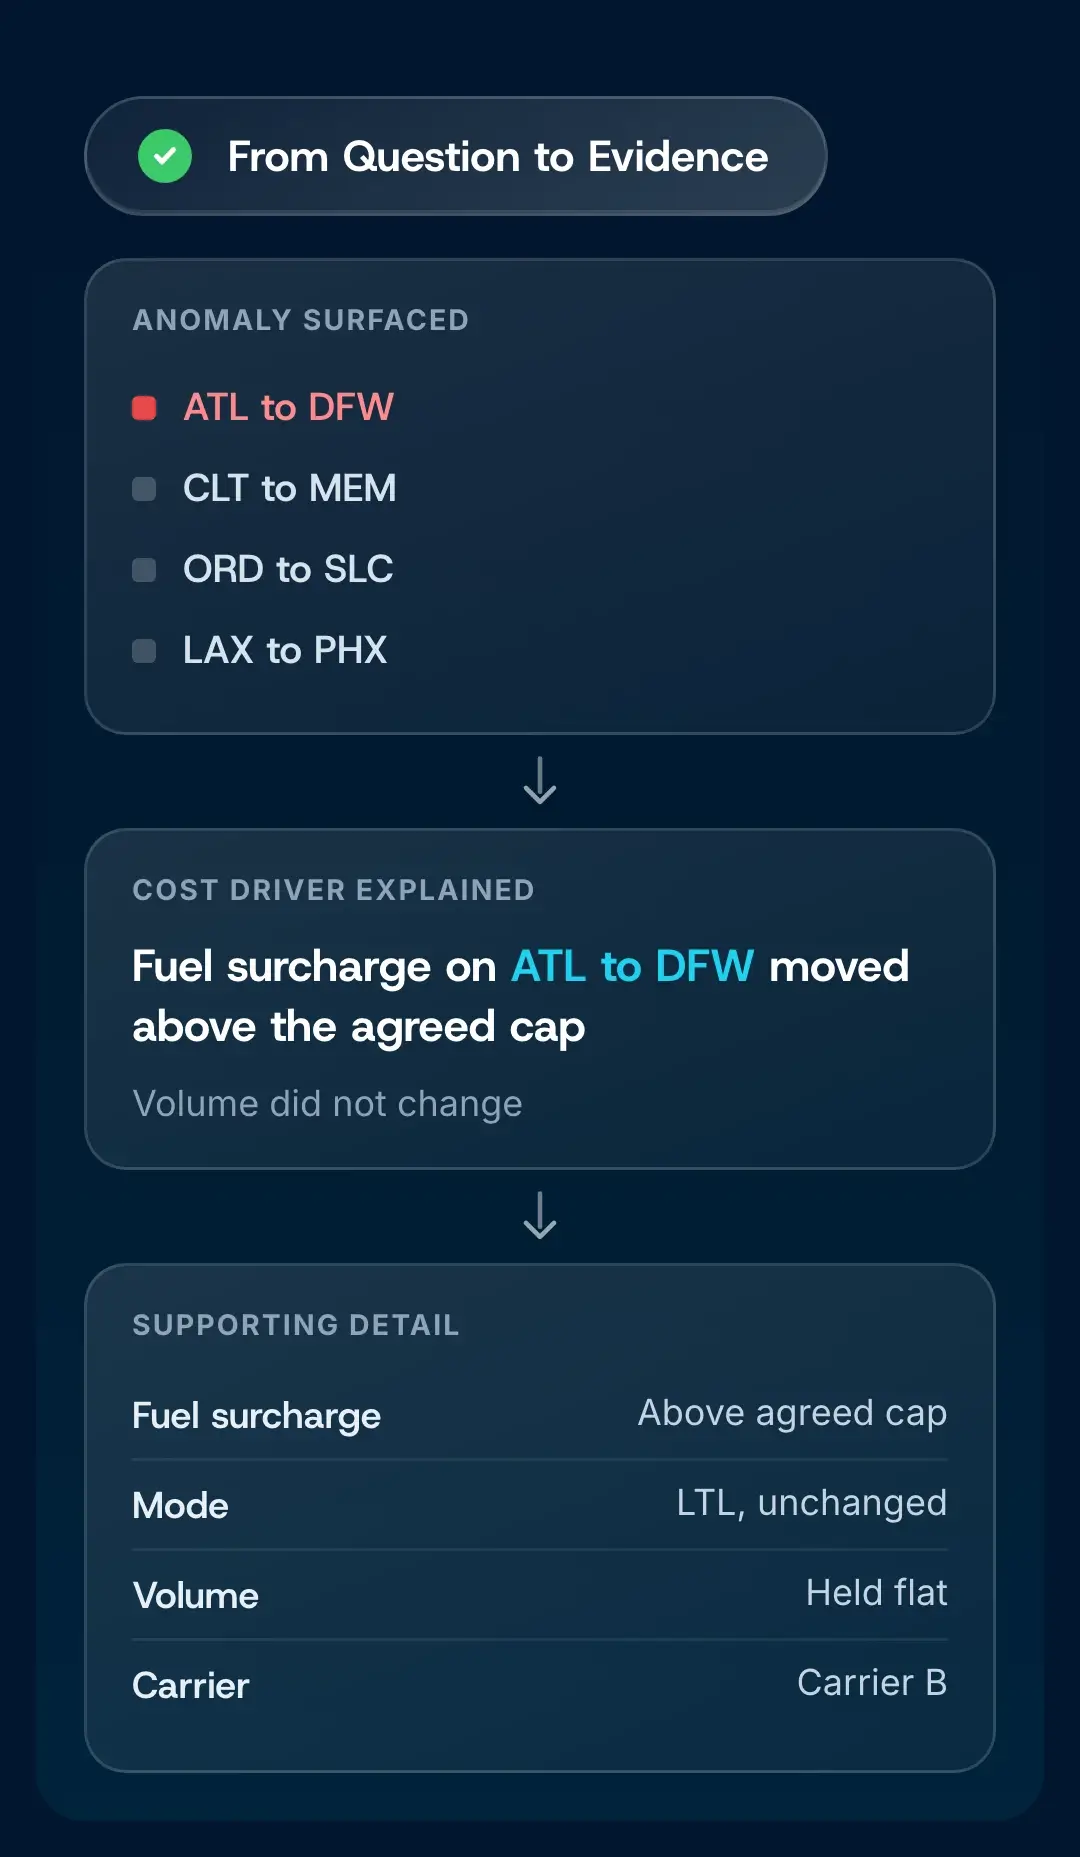
FreightOptics turns connected transportation data into decision-ready views. IRIS can surface anomalies, explain likely cost drivers, and show where carrier or mode performance changed. Your team can investigate the supporting lane or invoice data behind the change.
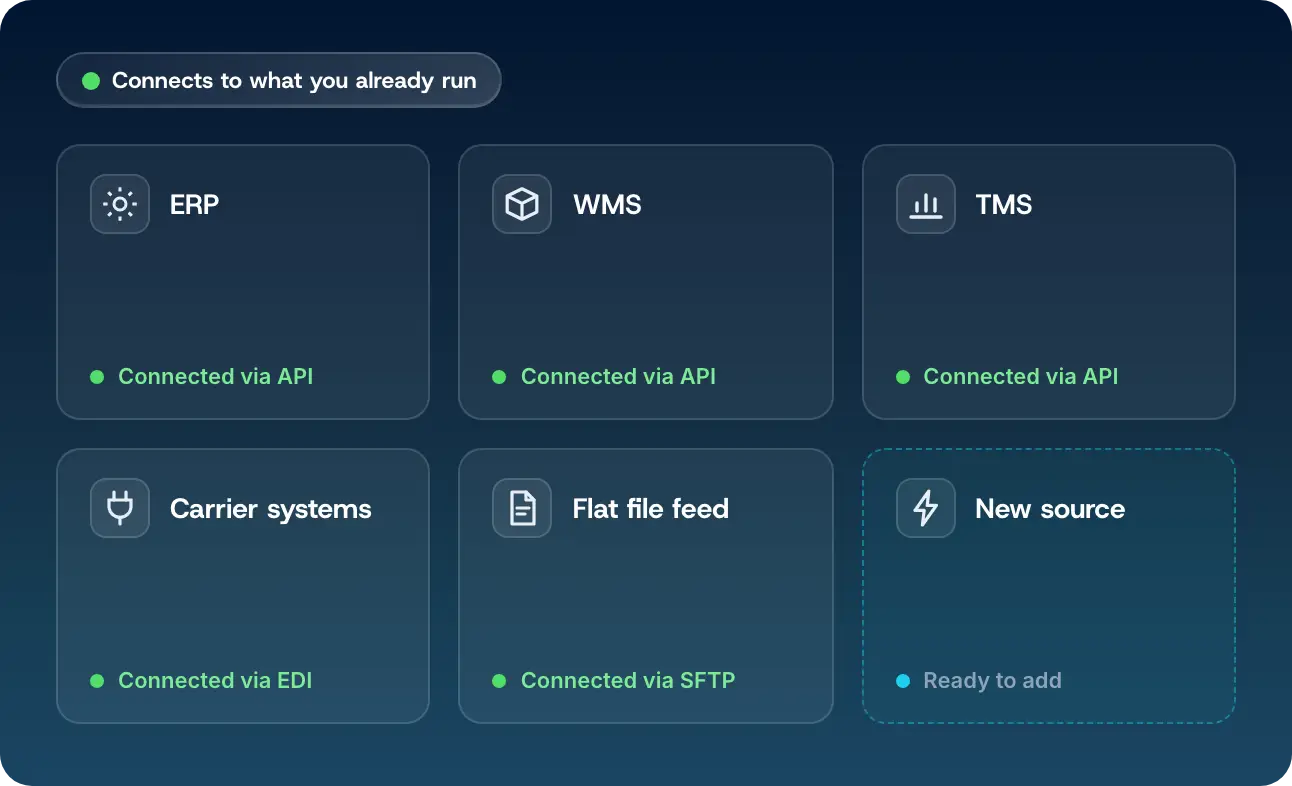
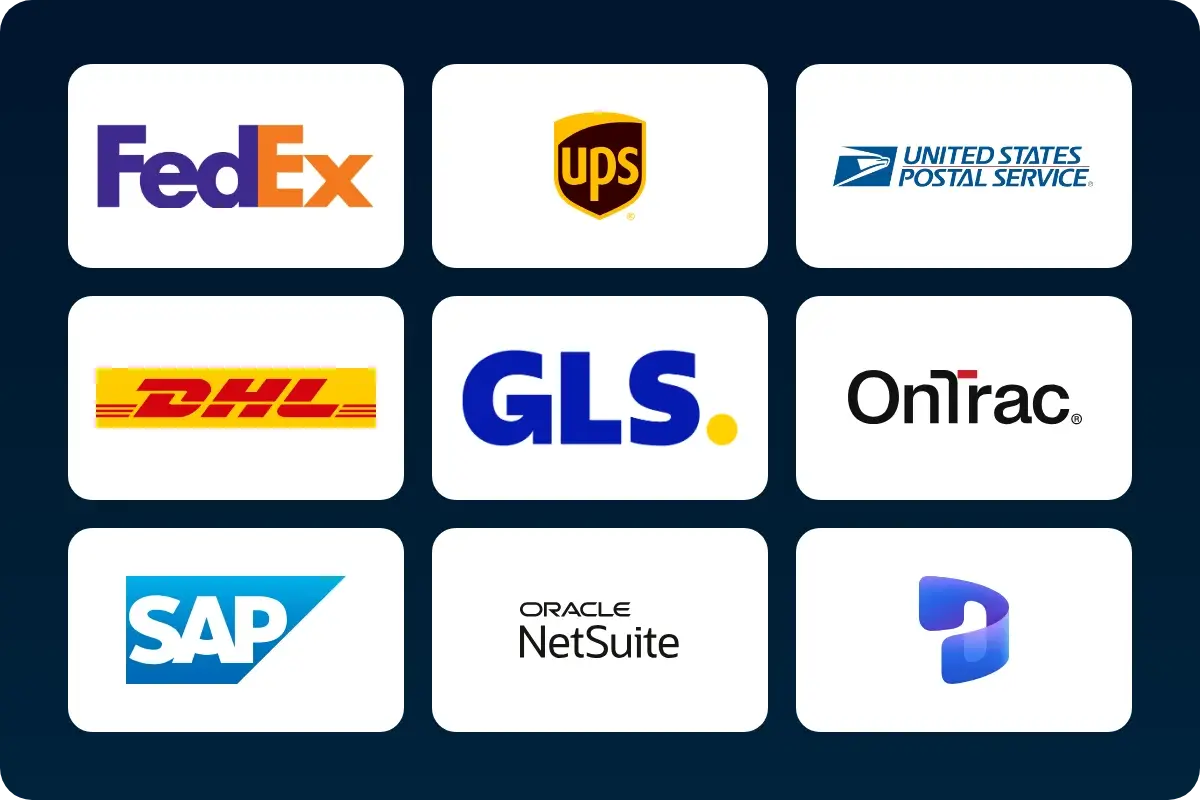
Bring supported ERP, WMS, and transportation data into one FreightOptics view through the connection method agreed with your team during onboarding.
Ask IRIS about connected transportation data. It can return a chart or table, investigate an anomaly, find an invoice, run a report, open a FreightOptics screen, or answer from help content and the glossary.
Use IRIS to move from a question to the supporting transportation data. Your team reviews the result and decides what should happen next.


See carrier, mode, and invoice data in one view. We will walk through the platform and discuss your reporting needs.
More than $1.7 billion in verified savings over 23 years.
Prefer to start with a conversation? [email protected] · +1 800-578-4939
Your information is confidential.